A tour history algorithm for a fleet of e-vehicles
- Degree programme: BSc in Informatik
- Author: Marius Anselm Lauener
- Thesis advisor: Prof. Dr. Kenneth Ritley
- Expert: Prof. Dr. Torsten Braun
- Year: 2023
This bachelor thesis focuses on the further development of a vehicle tour management application for Quickpac AG, Switzerland's largest B2B delivery services based on e-vehicles. This thesis aims to consolidate various data sources, to enable analysis of tour performance and quality. The result is a visual dashboard with mapping components and identification of delivery tour anomalies, essential for fleet managers to optimize delivery and assess performance.
Starting point
Quickpac is an all electric B2B package delivery service. Quickpac receives thousands of packages from businesses and then delivers them within the geographical areas that Quickpac covers. All these packages are algorithmically assigned to a tour that is optimized to make the path of deliveries as efficient as possible. A considerable amount of telematic data is recorded by different components of the Quickpac technologies. Every delivery vehicle sends its coordinates and current speed at regular intervals. Delivery personnel send delivery data over mobile devices when they confirm a delivery. Estimated times for the deliveries are generated by the system.
Contents of the thesis
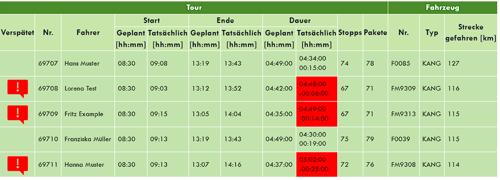
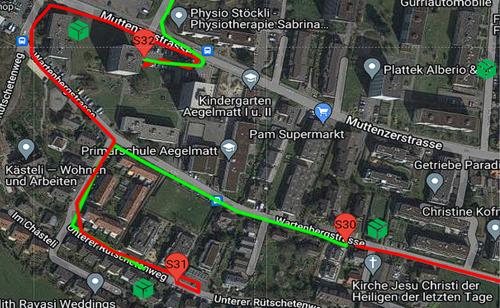
The app developed for this thesis algorithmically loads, transforms, assigns and combines the multiple data sources so that they can be shown and analyzed on the internal web page. The dashboard provides an overview of all the tours and their duration and if they were delayed, they are visibly marked. A tour can be selected and then the application provides more in-depth view about a completed tour. In this detailed view a Google map shows where the vehicle drove and made stops. These stretches are colored red and green respectively if they are delayed or on time. Below the map a table gives more detailed information to go along with the drawn stops. The table gives information for each stop if it was delayed or on time.
Outlook
Now that this application has shown its utility the goal is to take it out of the test environment and progressively role it out to all appropriate users. Another future feature will add the functionality to sort by delivery person, so that the performance of said person can be compared to performance over a greater timeframe, to determine a better picture of staff performance in general.